Contour lines and the digital terrain model — where the heights come from

Contour lines look like a convention inherited from map printing, but they are a computed result. Behind them sits a digital terrain model — a grid of millions of height values from which lines of equal elevation are derived. Understanding how that grid comes about, and what the contour interval does, changes how you read a terrain map and where you stop trusting it.
At a glance
- A DTM describes bare ground; a DSM describes the surface including buildings and trees.
- DGM1 means one height value per square metre — the current German official standard.
- The contour interval is the height difference between adjacent lines. It decides how much relief becomes visible.
- Tight lines mean steep, wide lines mean flat. Where lines are missing, the ground is level — or the model has a gap.
DTM, DSM, DGM — what is meant
The digital terrain model (DTM, German DGM) describes the earth’s surface stripped of everything standing on it: no buildings, no trees, no bridges. It is what an excavator would find. For design work, terrain sections and cut-and-fill calculations it is the right basis.
The digital surface model (DSM, German DOM) takes everything with it — roofs, tree canopies, masts. Useful for shading studies, sightlines and solar potential; useless for a terrain section, because buildings suddenly appear as hills.
Both are derived today mostly from airborne laser scanning: a pulse is emitted and its return measured. A pulse that finds its way through foliage down to the ground produces several returns — the last becomes the ground point, the first the surface. That is precisely why one flight campaign yields both models.
What DGM1 means
The number is the grid spacing in metres. DGM1 gives one height value per square metre, DGM5 one per 25 square metres, DGM25 one per 625. The finer the grid, the more relief survives — and the larger the file: one square kilometre at DGM1 is a million values.
Vertical accuracy is a different quantity from grid spacing. Official DGM1 data typically sits within a few decimetres in height. That is good for planning; it does not replace a survey on site for setting out.
Contour interval: the choice that decides everything
The contour interval is the height difference between two neighbouring lines. It is not a property of the terrain but a decision about the drawing — and it changes the image fundamentally:
- 1 m or 0.5 m — for a single plot, where steps in the ground matter.
- 5 to 10 m — neighbourhood and district scale; the relief becomes readable without the drawing clogging up.
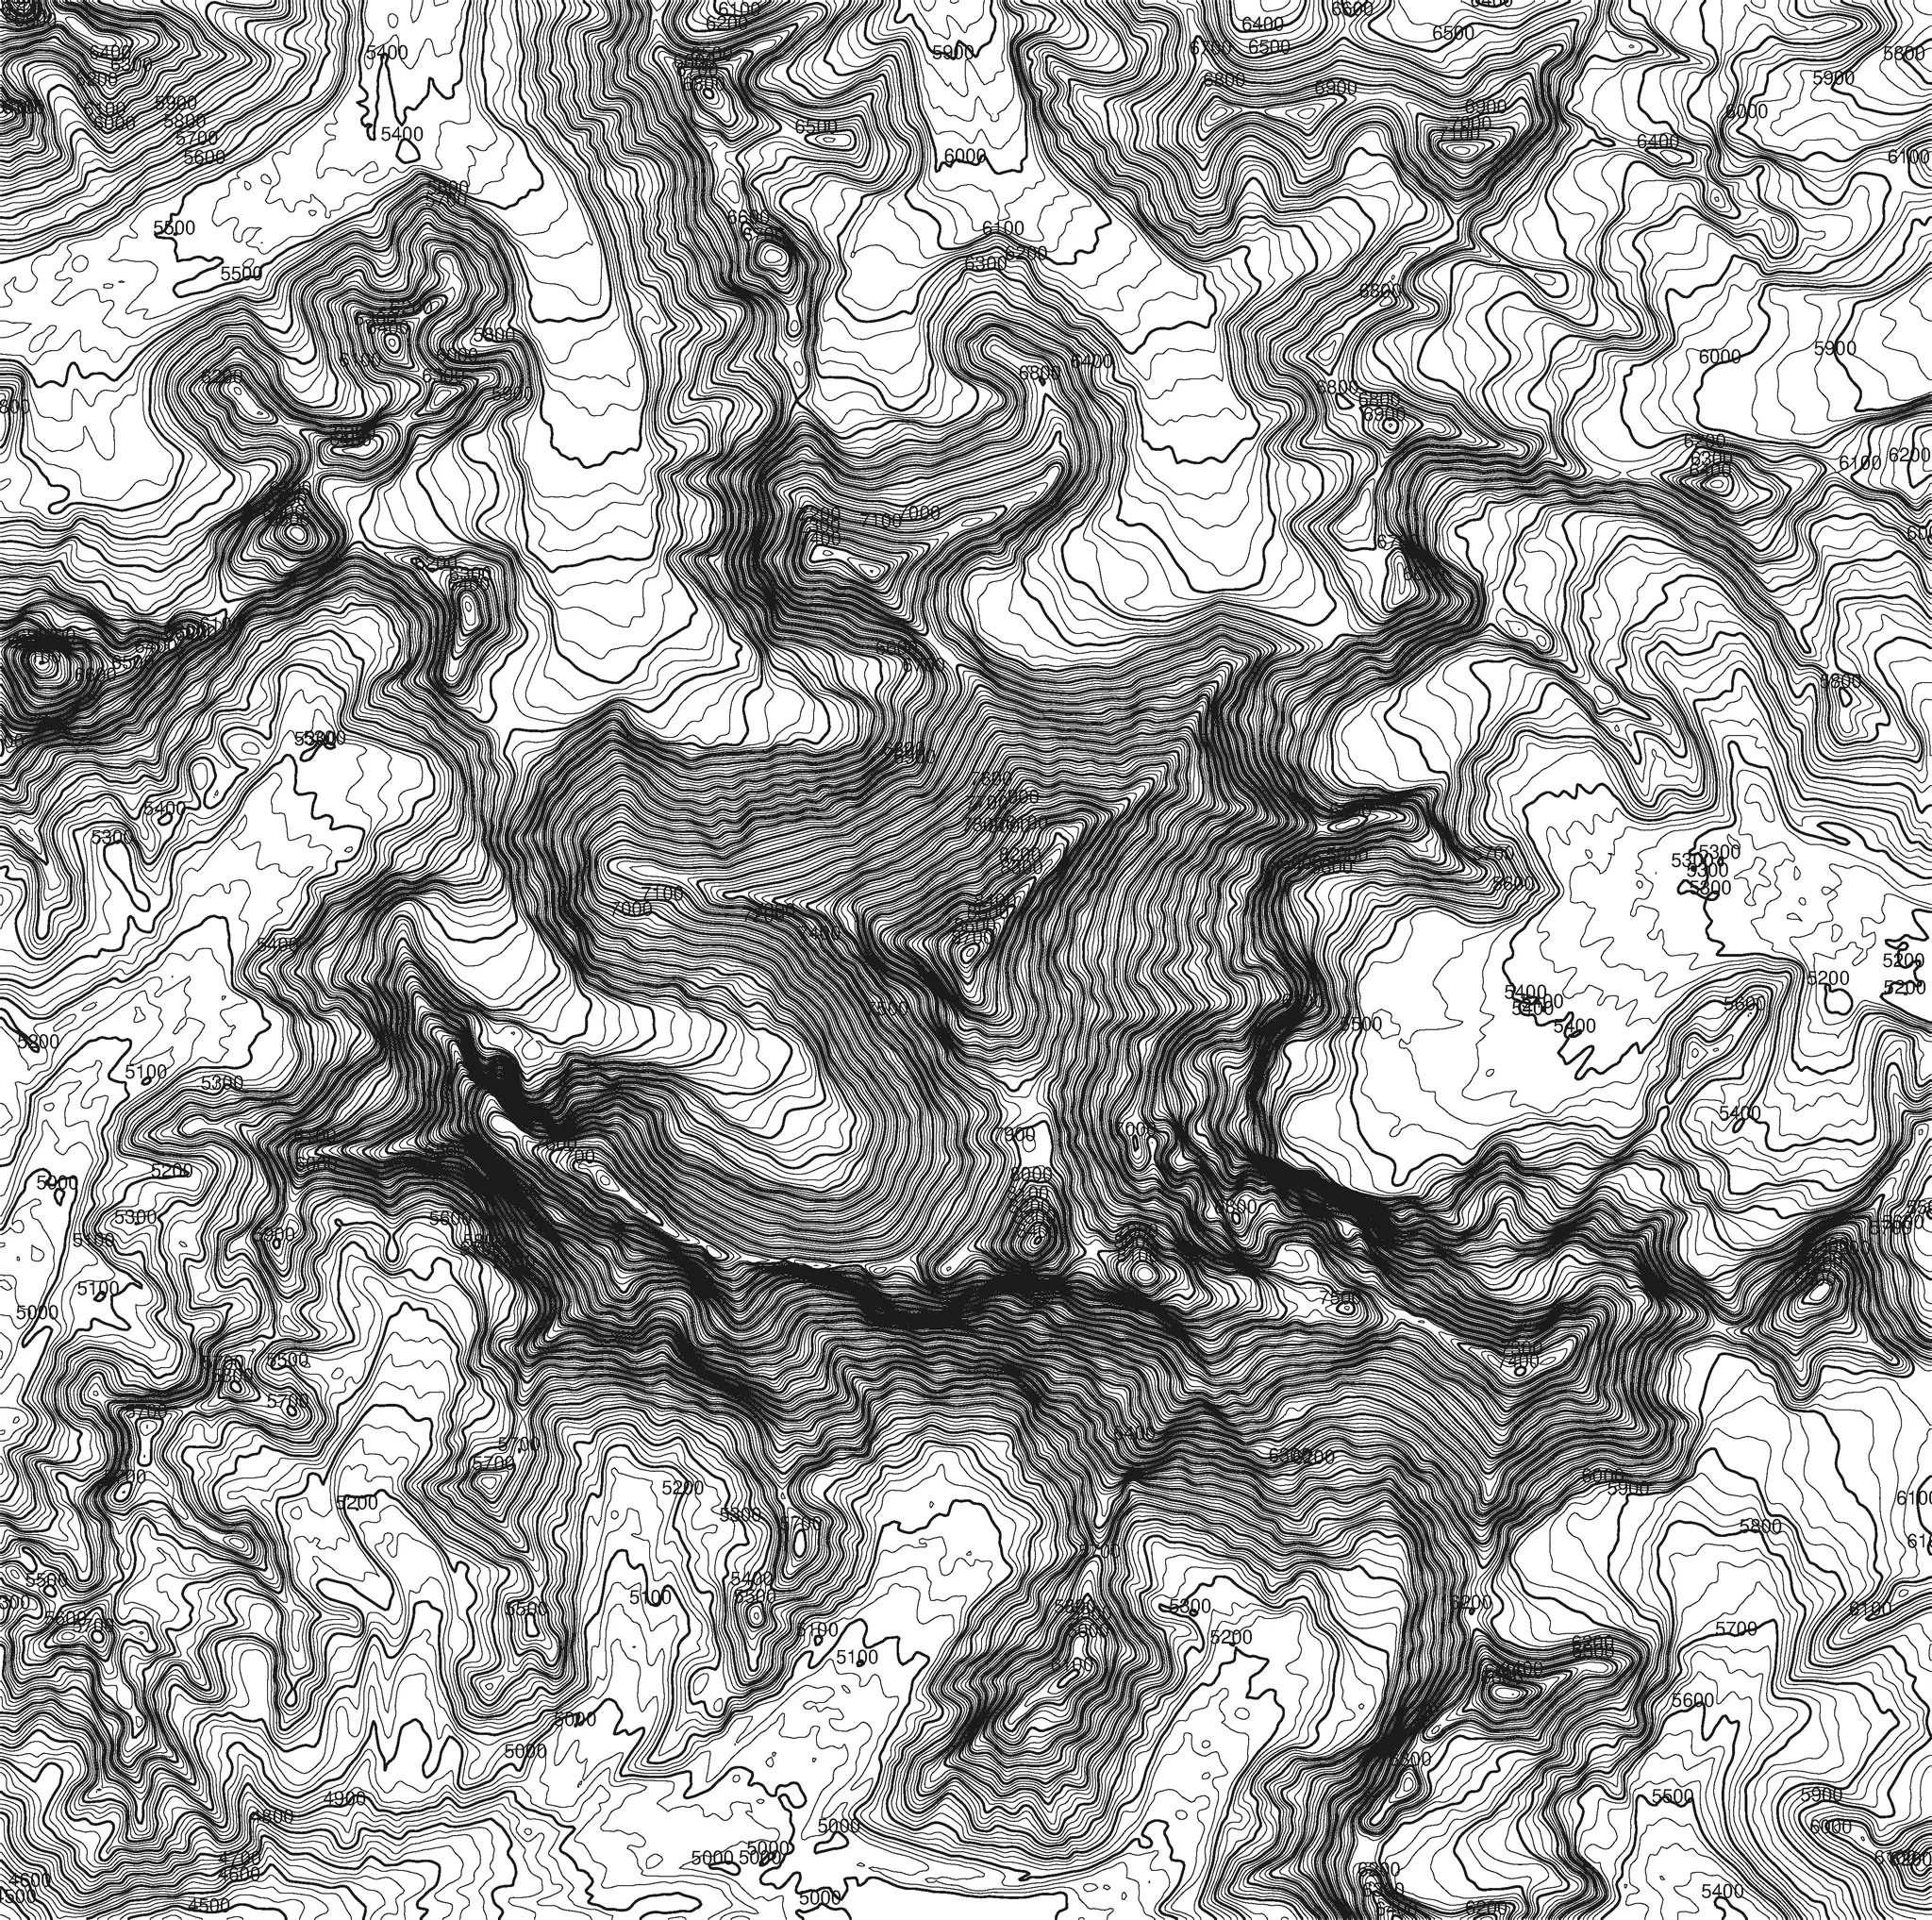
- 25 to 100 m — mountains and landscape, where a fine interval would produce nothing but a black field.
A useful rule of thumb: choose the interval so that lines sit at least roughly a millimetre apart at the printed scale. Anything tighter merges into a bar on paper anyway.
Reading contour lines
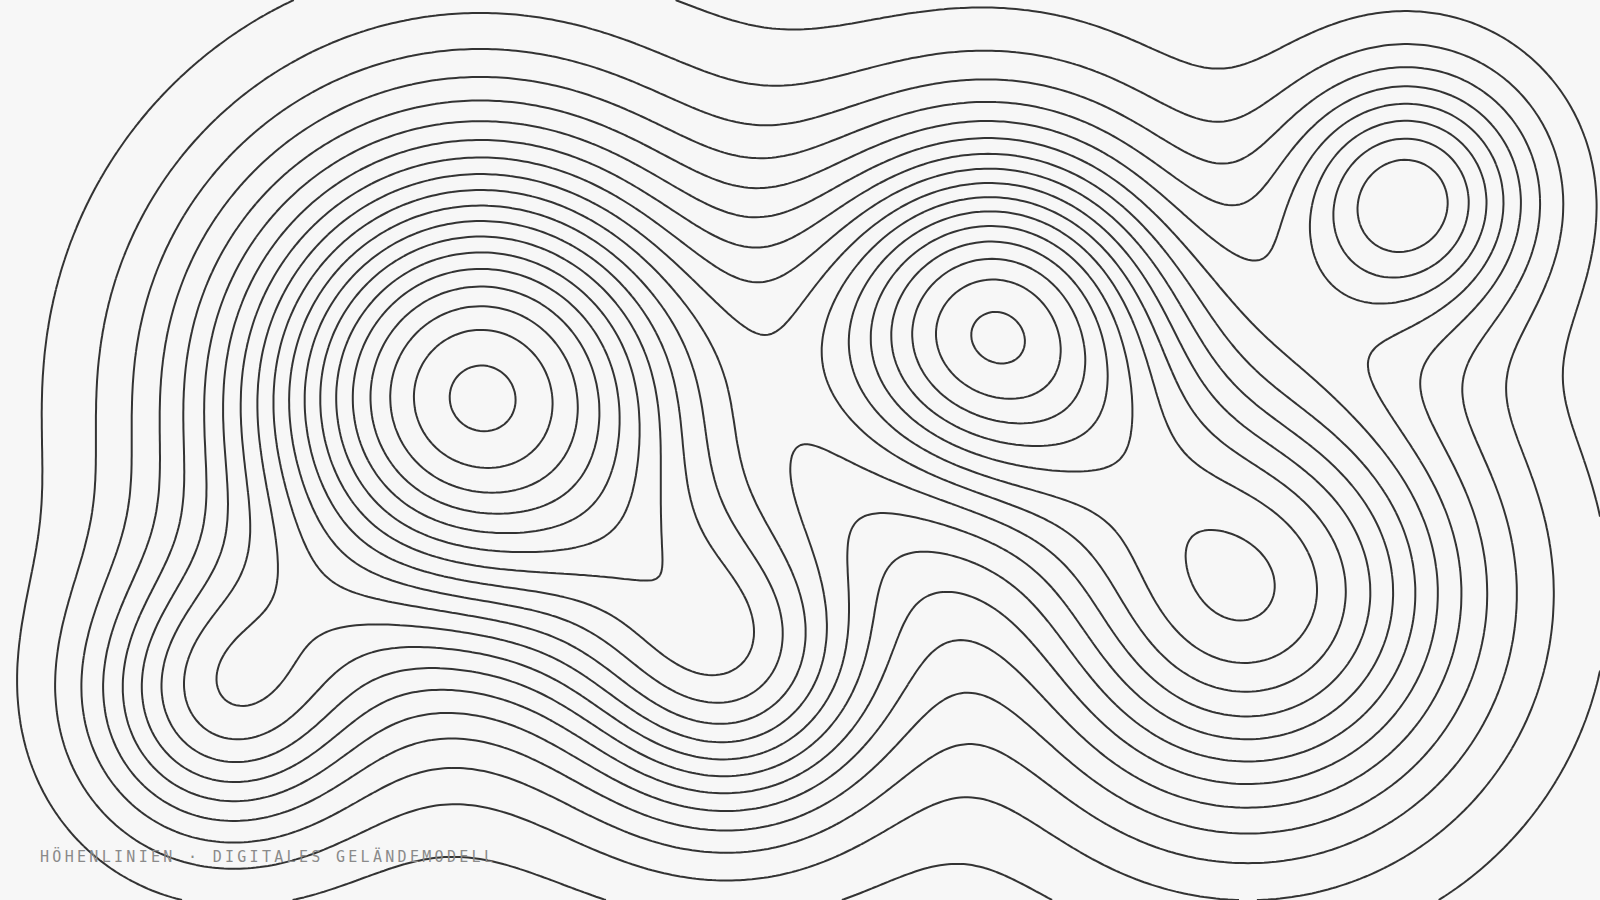
- Dense lines mean steepness; wide spacing means flat ground.
- Closed rings are summits or depressions. Which of the two only the labelling reveals — or hachures pointing into the hollow.
- A V pointing uphill is a valley or a watercourse. A V pointing downhill is a ridge.
- Lines never cross. Where it looks as though they do, there is an overhang or a retaining wall — a case for the survey, not for the model.
For a terrain section, count the lines along the section axis and plot the heights. One caveat: sections almost always exaggerate the vertical — two- to fivefold is common. The exaggeration factor belongs written on the section, otherwise someone will read it as true to scale.
Where the data comes from
In Germany the state survey authorities publish the elevation models, mostly free of charge under an open licence. Which one applies where, and how the attribution has to read, is set out in our overview of base geodata licences — the conditions differ, and contour lines derived from an elevation model are a modification that CC BY 4.0 requires you to declare.
Worldwide, freely available remote-sensing models step in — SRTM at roughly 30 metres grid spacing, Copernicus DEM similar. That is enough for mountains and landscape; nowhere near enough for a single plot.
Frequently asked
DTM or DSM — which do I need?
The DTM for terrain sections, earthworks and design bases. The DSM for shading, sightlines and solar potential. Using a DSM for a section turns buildings into landforms.
How accurate are the heights?
Official DGM1 data usually lands within a few decimetres. Good enough for planning and concept design, but no substitute for measurement on site — if only because the ground may have changed since the survey flight.
Why are lines missing in places?
Either the ground really is level there, or the model has a gap — under bridges, across water and in dense building fabric the laser pulse does not reach the ground cleanly. Such areas are interpolated and correspondingly uncertain.
Can I generate contour lines from a DTM myself?
Yes. In QGIS the toolbox handles it in one step under Raster → Extraction → Contour; the only input is the interval. What follows is usually the longer part — smoothing, labelling, bringing it onto a scale.
Ready-made contour maps
If the sheet matters more than the process: our Peak Maps show the 49 highest summits in the world as pure contour drawings — each at 10 m and 25 m interval, print-ready as PDF.
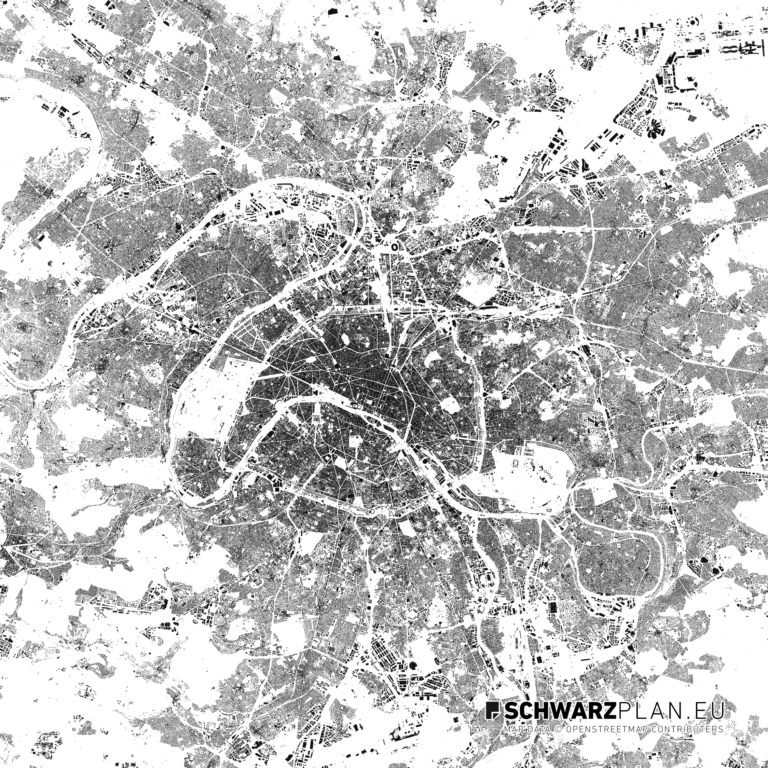
And for the urban context, the site and figure-ground plans deliver the built fabric as PDF, DXF and DWG with separated layers — contour lines included for many cities.