Create a city map
Creating a city map means turning open geodata into a readable map: choose the extent, grade the streets by importance, label what matters and leave out the rest. With QGIS and OpenStreetMap it costs nothing but time – with a ready-made vector base you start at step four.
6 steps · free route available
Decision
Three routes – which one fits you?
| Route | Time | Cost | Control | When it makes sense |
|---|---|---|---|---|
| Online generator | Minutes | free to moderate | limited | A one-off with no design ambition. Read the licence terms first – they vary a great deal. |
| Yourself in QGIS | Hours to days | time only | complete | When the map has to look exactly the way you picture it – or when you want to learn the route once and for all. |
| A ready-made vector plan as the base | Minutes | a few euros | complete from step 4 on | When the city is in the catalogue and time is short: sourcing and preparing the data falls away, but you still do the design yourself. |
Guide
Draw a city map – in six steps
-
01
Decide on the extent and the purpose
A city map for a poster shows something different from one for a brochure. Decide first how large the map will be and from what distance it will be read – how much extent fits and how small the type may go both follow from that.
-
02
Get the geodata
OpenStreetMap covers streets, buildings, green space, water and rail worldwide. Ready-made extracts come from Geofabrik, targeted queries from Overpass. For Germany, the open base geodata of the federal states comes on top.
-
03
Load into QGIS and clip to the extent
Each category as its own layer: streets, buildings, water, green, rail. Clip before you style, not after – a map holding half of Bavaria in memory redraws on every change.
-
04
Grade the streets by importance
This is the step that decides legibility. Motorway, main road, side street and footpath need different line weights – in OpenStreetMap the classification sits in the “highway” field and can be used directly as a styling rule.
-
05
Label – and leave out
Not every street gets a name. Label the ones people navigate by. Labels run along the line, not across it, and never overlap: in QGIS the collision detection handles that once you switch it on.
-
06
Scale, legend, attribution and export
A scale bar rather than a scale ratio, a north arrow, a short legend and the attribution for the map data. Export as vector PDF or SVG – then the map stays crisp from postcard to poster.
Craft
What makes a city map legible
Nobody fails on the data any more. Home-made city maps fail on five things, and all five are decisions, not tool questions.
01
Hierarchy before completeness
A city map on which every street looks the same is unreadable – even when it is complete. Three or four line-weight levels are enough for a city of any size.
02
Leaving out is design
The commonest mistake in a home-made city map is keeping everything the data contains. House numbers, fences, individual trees and car park areas belong out at most scales.
03
Few colours, clearly separated
Water blue, green space green, everything else in greys – nearly every city map gets by on that. Colour is a signal; when everything is coloured, nothing signals any more.
04
Type is part of the map, not on top of it
Labelling follows the geometry: street names run with the street, area names sit inside the area. A light halo around the type keeps it readable without erasing the lines beneath.
05
One scale, one level of detail
A map showing every building in the centre and only main roads at the edge looks unfinished. Either the detail is even throughout – or the transition is deliberately designed and visibly meant.
What it is good for
City map, figure-ground plan, site plan, location map
Four maps of the same place, four different purposes. Build the wrong type and you do the work twice.
| Type | What it shows | For what |
|---|---|---|
| City map this page | A readable map of an urban area with street hierarchy and labelling | Orientation, brochure, poster |
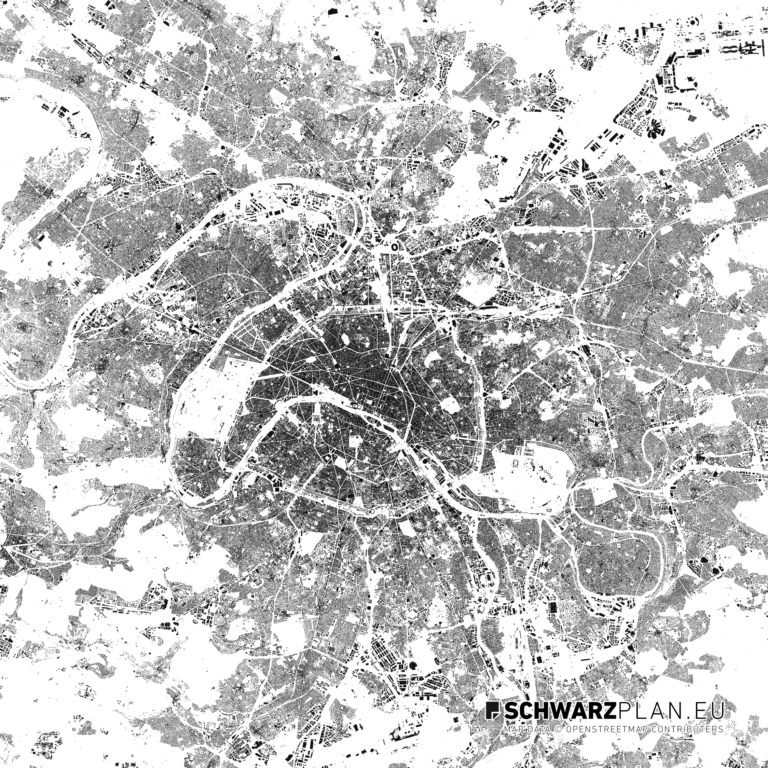
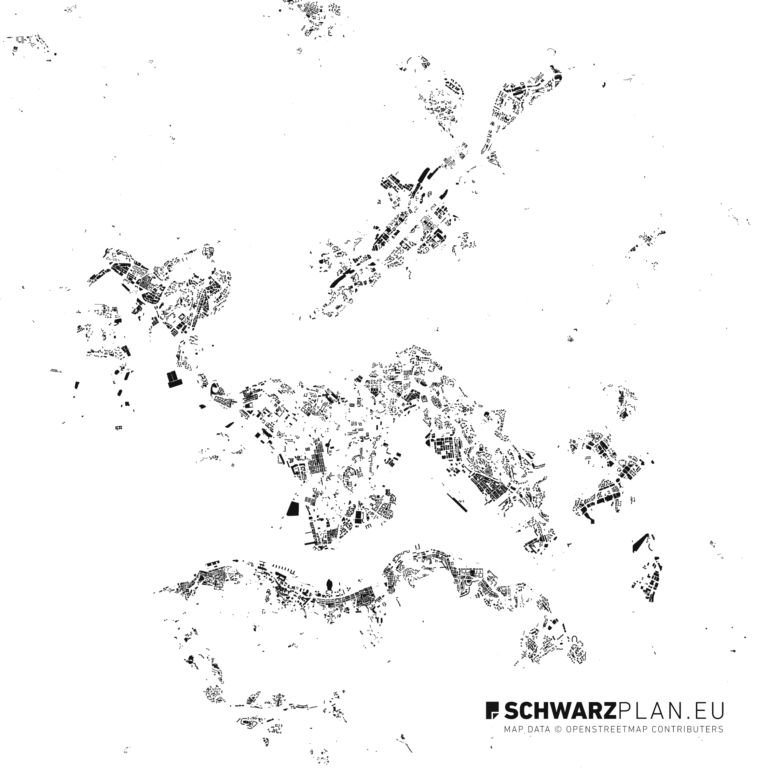
| Schwarzplan (figure-ground plan) | Buildings only, black on white – built against unbuilt | Urban design, analysis |
| Lageplan (site plan) | One plot with its surroundings, true to scale | Planning, building application |
| Location map | A simplified route to a destination; may distort | Invitation, letterhead, legal notice |
Legal position
Which data you may use
You may use OpenStreetMap, commercially too, with the attribution “© OpenStreetMap contributors”. You may not use a screenshot from Google Maps as your base – their terms allow embedding the map, not freely reusing an extent in your own material.
On top of that come the open base geodata of the German federal states, usually under Datenlizenz Deutschland with a prescribed attribution. If you pass the data on as a dataset rather than as a finished map, OpenStreetMap additionally requires you to observe the ODbL.
This overview describes common practice and is not legal advice.
Shortcut
Start at step four
Steps two and three – fetching, loading, clipping the data – are the dull ones. A ready-made vector plan brings them along: streets, buildings, water, green and rail on separate layers, true to scale and already cropped. You still do the design yourself, and that is the part worth doing.
FAQ